Note: This article was previously titled “Sorry GOP, Biden didn’t cause prices to surge.” Since Biden is no longer in the race, but the talking point has remained the same, I have re-titled this article. It is important for people to know how policies in 2020 primed the economy for inflationary surges.
UPDATE: While this article does a great job of showing how the expansion of money supply relative to economic production caused inflation in the United States, that’s only a small part of the story. The same argument needs to be looked at from a global scale: In 2020, the money supply in the central banks of the United States, Japan, China, and Europe, all expanded sharply in relation to the world GDP. This caused global inflation in 2021 and 2022 that only the most isolated of nations escaped. This further shows how out of the hands of any one person within the United States this was.
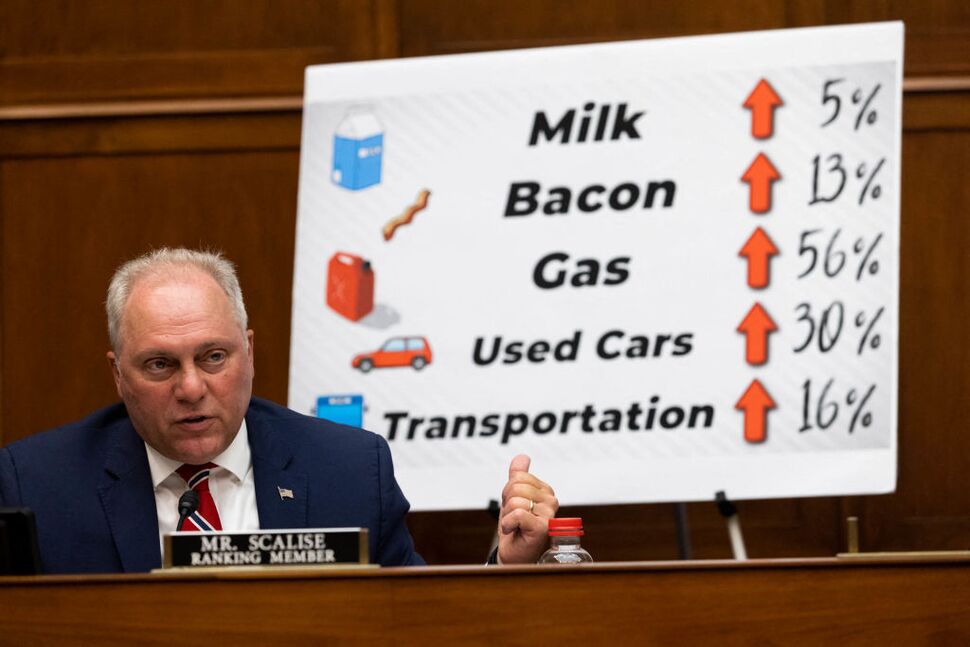
Over the past few years, inflation – the increase in prices of goods and services over time – has been potentially the biggest social and economic talking point. I have seen this both inside the classroom with my Economics students and elsewhere. And for good reason: the average cost of something today is 22% greater than it was in January of 2020, right before the start of the pandemic. Republicans have seized the opportunity to use this against Joe Biden in the upcoming election, and it has been effective since these price increases have hit our wallets hard. At a recent city festival, I saw a large billboard over the GOP tent which listed the prices of a few things today vs. what they were in 2020. Often, the question is asked: “Are you better off today than four years ago?” For most of us, the answer is no. This point is exacerbated by the fact that the economy was largely still in lockdown and consequently, inflation was artificially low when President Trump left office.
But when pressed on exactly what Biden did to cause inflation, Republicans are at a loss for specific answers. On July 16th, Bill O’Reilly went on the Daily Show and pulled out his list of prices that went up significantly under Biden. After O’Reilly falsely claimed that Trump had two years post-pandemic in office,1 Jon Stewart asked what Biden did to cause inflation. O’Reilly’s response: “I don’t know, and that’s what I would ask him.” The crowd guffawed and Stewart was so beside himself that he got up out of his chair and walked across the stage. That’s because O’Reilly’s response is typical not only of political posturing and collective amnesia, but also of the fallacy that whoever’s in charge at any given time must be fully responsible for those present economic conditions. On the contrary, what we call the economy is the result of hundreds of millions of individual decisions, adhering to and influenced by policies that are often implemented years earlier. In the case of the 2021-2022 inflation spike, the policies which contributed the most were enacted while Donald Trump was still president.
Summary
For those who want the Sparknotes version of the argument without having to read the whole article, I have provided a summary of the main points here. Obviously, more detailed evidence is presented below.
- Arguably the most common and effective talking point for Republicans against Biden is inflation, and in particular, pointing out the prices of things now versus four years ago.
- Yet, Republicans are mum on exactly what Joe Biden did to make prices of things go up.
- At the most fundamental level, inflation – the increase of goods and services over time – is caused by too much money chasing too few goods and services. This usually happens in two ways: expansion of the money supply that outpaces production and a supply shock which inhibits or reduces production on a large scale.
- The post COVID inflation was the result of both of the above causes: a rapid expansion of the money supply coupled with worldwide supply chain and production disruptions due to COVID-19.
- The latter is out of any single world leader’s control, so it will not be covered in depth here.
- In 2020, when Donald Trump was president, the M22 money supply expanded by by $3.7 trillion (24%), which is equivalent to the previous five years of money supply expansion.
- On March 27th, 2020, President Trump signed into law the CARES Act, which allocated $2.2 trillion for COVID-19 relief, which was distributed later that year.
- President Trump signed into law two more COVID-19 relief bills, with another $1.4T of spending for relief. Altogether, Trump signed into law bills which allocated $3.6 trillion for COVID relief. The federal spending rate as a share of Gross Domestic Product (GDP) ballooned to 47.0% in 2020 – the highest in United States history.
- Per famed economist Thomas Sowell, there is an economic lag of anywhere from nine to 18 months from the time a policy is put in place to the time the economy feels the effects of the policy.
- Inflation was leveled out at 1.4% when Joe Biden assumed office, and started increasing sharply within two months. Setting aside the fact that the president does not have a magic wand that can so heavily influence economic policy (that would be congress and the Federal Reserve whose actions most affect the economy), even if some policy were put in place the day Biden took office, there is virtually no way it could’ve had such a profound effect on inflation almost instantaneously.
- However, the sharp expansion of money supply and signing of initial COVID bills in 2020 (when Trump was president), coupled with the full-scale reopening of the economy in 2021, provides a strong, evidence-based explanation for the 2021-2022 inflation spike which also fit’s Sowell’s economic lag timeline.
What causes inflation?
Inflation, at some level, is caused by too much money chasing too few goods. This comes in two major forms: demand-pull inflation, where an expansion of the money supply that outpaces production causes consumers to bid up the prices of goods and services, and cost-push inflation, in which the costs of production and distribution across the economy increase, restricting supply and sending prices upwards. The latter cause can be influenced by any policy that makes it more costly to produce goods and services, but also by the gradual exhaustion of certain resources or, more commonly, unexpected supply shocks. A supply shock is when a major and sudden event occurs which inhibits economic production, such as a war, natural disaster, or in this case, pandemic. These supply shocks are often outside the control of politicians, and force leaders into reactionary positions. In the case of COVID, labor shortages, supply chain dysfunction, port closures, the slow rate or altogether inability of businesses and processing facilities to reopen post-lockdown, and a host of other unfortunate circumstances restricted the world economy’s ability to supply goods, driving up prices.
COVID Relief Spending
On March 27th, 2020 President Trump signed into law the bipartisan Coronavirus Aid, Relief, and Economic Security (CARES) Act, which allocated $2.2 trillion to be spent on economic aid for families and small businesses. Among the provisions were $1200 direct cash payments to all adults making less than $75,000 per year, loans available for small businesses, expanded unemployment benefits, a moratorium on mortgage and rent obligations, and financial aid to the airline industry. Subsequent bills that year expanded benefits and funding for COVID relief programs by another $1.4 trillion, totalling $3.6 trillion. The last of these bills, the Consolidated Appropriations Act (CAA) of 2021, allocated $900 billion for COVID-19 programs lumped into an omnibus spending bill for FY 2021.3
To accommodate this influx of spending, which sent the ratio of government spending as a share of GDP for the year 2020 (47.0%)4 to its highest level in United States history, the money supply had to expand at an unprecedented rate. In a three month period from February to May, M2 expanded by $2.5 trillion (17%). By the end of the year, M2 had expanded a total of $3.7 trillion (24%). In comparison, after a peak expansion of $2.4 trillion during the first year and a half of Biden’s term, the money supply shrank, leaving a net expansion of $1.7 trillion. This is shown on the graph below.

Since inflation is caused by too much money chasing too few goods and services, another way to conceptualize this is the ratio of money supply to GDP, or how many dollars of money supply are there per dollar of economic output. Below is a chart that superimposes this ratio with the inflation rate.

Prior to the pandemic, the M2/GDP ratio was 0.71, meaning that there was $0.71 of money in circulation for every dollar of economic production. In a short span, that number spiked to $0.93 before dropping slightly below $0.90. This is an unprecedented money supply expansion relative to economic production in a short period of time.
After Biden took office, one more large COVID relief package – The American Rescue Plan of 2021 – was signed into law on March 11th of 2021, allocating another $1.9 trillion for relief packages. This package included another round of $1400 stimulus checks – the rest of the $2000 check Trump advocated for in the previous bill but did not get – along with expanded unemployment benefits and Child Tax Credit. It is certainly not out of bounds to argue that this bill contributed, to some extent, to inflation of the following year. But there are some considerations that cast in doubt how large its impact was. For one, inflation had already begun surging upwards when the bill was passed, so it could not have caused the initial spike. On top of that, it’s important to consider that government spending as a share of GDP fell by nearly 5 percentage points from 2020 to 2021, and that the budget for FY 2021 was passed while Trump was still president. Furthermore, this bill, despite its magnitude, had little to no effect on the M2/GDP ratio. At the very least, if one does fault this bill for contributing to inflation, it would be hypocritical to place all the blame for inflation on Biden’s spending while exonerating Trump’s far greater spending the year before.
Analyzing Inflation Trends
Below is a chart of the inflation rate from 2019 through the present.

A few things jump out immediately. First, as we know, inflation dropped when the pandemic hit due to an economy on lockdown. Secondly, inflation surged shortly after Biden assumed office. To Republicans, this visual is a goldmine – ostensibly undeniable proof of Biden’s culpability that can be peddled to the economically naive. But as we know, correlation does not always equal causation, and there are some fatal flaws with this argument, beginning with immediacy. According to famed economist Thomas Sowell, there is usually an economic lag period of anywhere from nine to 18 months from the time a policy is implemented and the time the economy feels its effects. When you think about it, this makes perfect sense, especially at the federal level. Once a bill is passed, particularly a new spending bill, it takes time to set up the programs and get the money out into the economy. In addition, there are over 130 million households in the United States, and reaction time to the altered economic circumstances will vary. Since the inflation began to surge within only two months of Biden’s inauguration, it is next to impossible that any policy put in place in that time frame would have caused it. On top of that, the president is limited in what he can single-handedly do to affect the economy – those powers lie with the Federal Reserve (monetary policy) and the legislature (fiscal policy). Rather, it had been just around a year since the first massive COVID-19 relief bills and money supply expansion that came with it, in line with Sowell’s economic lag timeframe.
But to really understand why inflation spiked so much when it did, we need to turn to monetarism, which examines the relationship between money supply and inflation. Monetarist theory suggests that MV = PQ, where M is the money supply, V is the velocity (how fast money changes hands), P is the price level (inflation), and Q is the real output measured in GDP. Since we are focused on inflation, we can manipulate the equation to isolate P as follows: P = V*(M/Q). I’ve highlighted M/Q because that is the M2/GDP ratio represented by the red line on the chart above. This value remained at a constant rate of 0.89 from late 2020 into early 2022, when it started to decline due to the Federal Reserve hiking interest rates. Mathematically, since P is accelerating while M/Q remains constant, that means that the inflation must be caused by an increase in velocity. In other words, inflation spiked when it did because money started changing hands at a faster rate. During 2020 when the economy was locked down and everyone was at home, money was changing hands slowly, thus we had a low inflation rate even with the greatly expanded money supply. But when the economy opened up and money started changing hands faster, prices had nowhere to go but up. Unless someone can make an argument as to how Joe Biden convinced people to spend money faster and make more economic transactions (or that it’s a bad thing), then we must concede that he did not cause this rapid increase in prices.
One last point here: this trend of rapid expansion of money supply and subsequent inflation the following year is seen in a number of countries across the world. It would be almost impossible to make an argument that Biden controls the inflation rate in all of these other countries.
What about oil prices?
Another common argument is that the inflation rate is reliant on world crude oil prices and since Joe Biden is so hostile to oil, he drove up prices, and with it inflation. Both of these arguments have their flaws, but I will begin with the latter. It is true that Democrats want to shift to green energy, but there is no policy Biden enacted that has so completely stunted oil production, especially that early on in his term. What about the Keystone Pipeline? Glad you asked. While it is true Biden permanently nixed the pipeline, it was not scheduled to be operational until 2023, long after the inflation had come and gone. Furthermore, oil is a world market, and the prices of crude most heavily rely on the whims of OPEC+. And, contrary to what Republicans claim about energy independence under Trump vs. Biden, it has currently reached record levels.
To address the former point, while it is true that crude oil prices often influence the contours of inflation, they are not a strong determinant of the overall inflation rate. Below are charts showing inflation rate (bottom) and crude oil prices5 (top) from late 2000 to 2024.

A few observations:
- The crude oil trend from 2002 to mid 2008 is consistently upwards, to the point that crude is 6.5 times what it was. Yet we don’t see nearly as pronounced and steady of an upward trend in inflation.
- From 2010-2014, crude was over $100/barrel, peaking at $138/barrel, more than the peak in 2022. Yet, there was no significant spike in inflation during that period. In fact, the current inflation level over the past year is higher than the average inflation level during the 2010-2014 time period, even though crude has been significantly cheaper recently.
- The crude oil price spike of 2022 only briefly touches the sustained 2010-2014 crude oil level, yet the inflation rate in 2022 topped out at 9.1%, compared to a brief spike of 3.9% in 2011. If crude oil prices were almost $40/barrel more in 2011, how come inflation was so much higher in 2022?
- Crude oil was $80/barrel more in 2008 than it was during the 2022 spike, yet the inflation apex in 2022 was 3.5 percentage points greater than that of 2008.
In sum, crude oil prices are not a strong determinant of the inflation rate, and there are always other factors at work.
Inflation – A policy choice
It is commonly stated that inflation is always a policy choice. I don’t necessarily disagree with this. During the presidential debate, one of the only sensible and accurate things Trump said was that in 2020, they needed to make sure there was money available for an economic recovery post-COVID. This highlights the dilemma lawmakers faced from an economic perspective, which was a tradeoff between potentially high inflation or a potentially devastating, prolonged recession. Our leaders chose the former by expanding the money supply spending so much in economic stimulus packages. I am in no way judging them for making that choice, because I think it was the right choice to make. The consequences of a prolonged recession would likely have been far greater than the consequences of the inflation we faced. With that said, it is wrong for Republicans to blame Biden for the effects of policies that were enacted during COVID under Trump.
A word on “Corporate Price Gouging”
Since this article, at its heart, is about misleading political messaging regarding inflation, I’d be remiss if I didn’t balance it out with talk about misleading messaging from the left. One often-repeated point is that inflation is caused by corporations greedily raising prices above some perceived morally correct level, thus raking in record profits. This line of thinking assumes that corporations all the sudden became greedy when the pandemic hit. Rather, corporations are always trying to raise prices as much as they can, just like consumers are always trying to get what they want at the lowest prices. The difference now is that the distorted post-covid market forces provide conditions that enable corporations to raise prices. In particular, as we’ve seen, the greatly expanded money supply has flooded the economy with potential demand. Households have two choices: they can either save the money, or spend the money. Most spend. When they do, all of that money has to go somewhere, and it goes to the companies they buy from. Therefore, while it is true that corporate profits are at record levels, that is a symptom of – not a cause of – inflation.
But if corporations are the ones ultimately raising the prices, aren’t they responsible? Yes and no. Corporations raise the prices not only because they can, but at some level, they have to. When there is an increase in income across the economy, it shifts demand upward, resulting in a new equilibrium point with a higher price level. If prices don’t increase to meet this demand shift, all of the goods will be cleared out, resulting in mass shortages. People will have excess cash, but won’t be able to buy anything with it. Furthermore, because of the law of increased marginal costs, it becomes expensive for businesses to increase production past a certain point, therefore requiring a certain level of profit to make it worth the endeavor.
Conclusion
Republicans have incessantly repeated the claim that Joe Biden is responsible for the surge in prices over the past few years. But as we’ve seen, the extent to which that’s true is questionable. The vast majority of the money supply expansion and accompanying government spending in response to COVID-19 that ultimately led to inflation came during 2020 when Donald Trump was president. This was an unprecedented money supply expansion in such a short time period – $2.5 trillion over the course of three months, $3.7 trillion for the whole year – that primed the inflation rate to skyrocket when the economy reopened the following year. Given that there is an economic lag period between the time policies are enacted and the time the economy feels the effects of those policies, Republicans have yet to provide an explanation of what Biden did so early in his presidency that so instantaneously caused inflation. Rather, the explanation here does fit Sowell’s timeline.
Image credit: US News and World Report
Footnotes
- While technically COVID-19 appeared in the late fall of 2019, the pandemic really began in March 2020 when the economy shut down. Donald Trump left office in January of the following year, while the economy was very much still dealing with COVID.
- M2 is a measure of money supply that includes cash, CDs, savings accounts, and other short-term bank deposits. It is frequently used by economists in inflation calculations.
- The fiscal year ends in October of 2021.
- This metric is the ratio of government spending to total GDP. Higher relative values can be an indicator of high deficits, accumulation of debt, and potential inflation. While this is the highest absolute value in history, there were other time periods where the increase relative to baseline was higher. For example, while government spending as a share of GDP didn’t quite hit 47% during World War II, it was relatively much greater compared to the 18% prior to the war.
- Inflation chart source: Trading Economics. World Crude Oil chart source: Macrotrends.

Leave a comment